Group Performance Reports
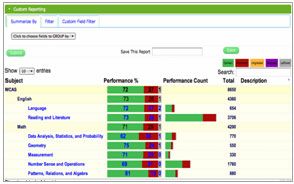
Socrato group reporting engine makes it easy to pinpoint the issues area for an individual or a class.
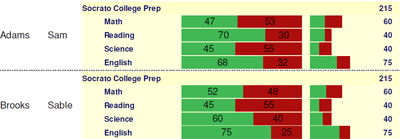
The Socrato reports are also available for groups and classes. Group reports make it easy to manage and track the performance of the entire cohort of students. They allow you to pinpoint the areas individuals or the group need to focus on the most.
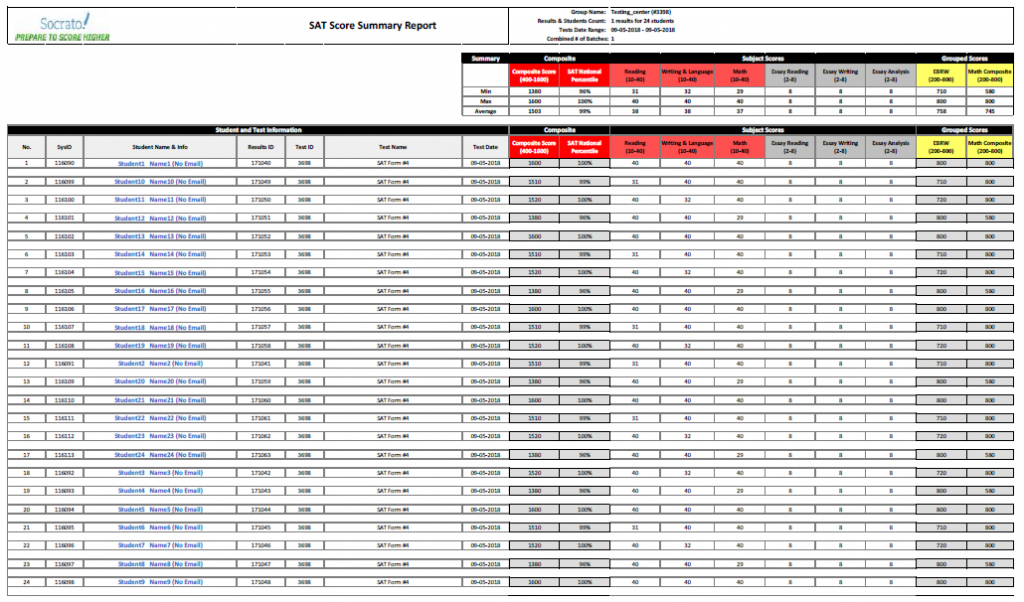
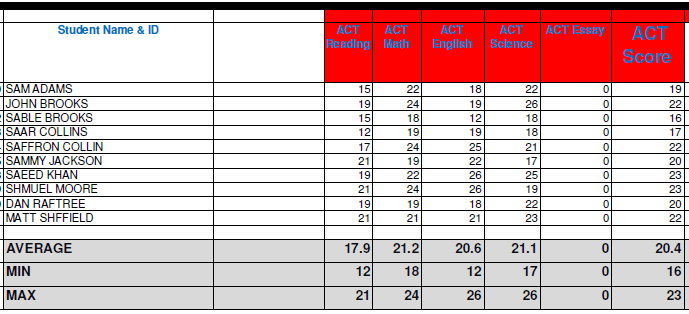
The Score Summary Report is available as a data download. Users can download the data and run different analyses for a class as a whole or a subset of students when a group of students takes the same Test. You can generate a score summary report to see the trends, average score, and more. Additionally, the data can be downloaded to MS Excel or other tools for even more powerful reports. These reports are crucial to see the big picture of the performance of the group of students or an individual student.
The data is available from Socrato which be copied to MS Excel or other analysis tools to generate evermore powerful reports. These reports are very helpful to see the big picture of the group of students as well as an individual students.
Excel file includes the following important and crucial information:
- Score: Scores Tab displays the scaled score of all the subjects and the total score.
- Percentage: Displays the percentage of each subject as well as the total percentage of a student.
- Points: Also includes the total number of questions correct.
- Benchmark: Measures if the student met or did not meet the benchmark value provided by the test organization.
- Comparative: The Test is also compared with another standardized test.
- Percentile: Similarly, percentile data (ACT, SAT, etc.) which is the National level cumulative percentile for all the subjects are also included in the report.
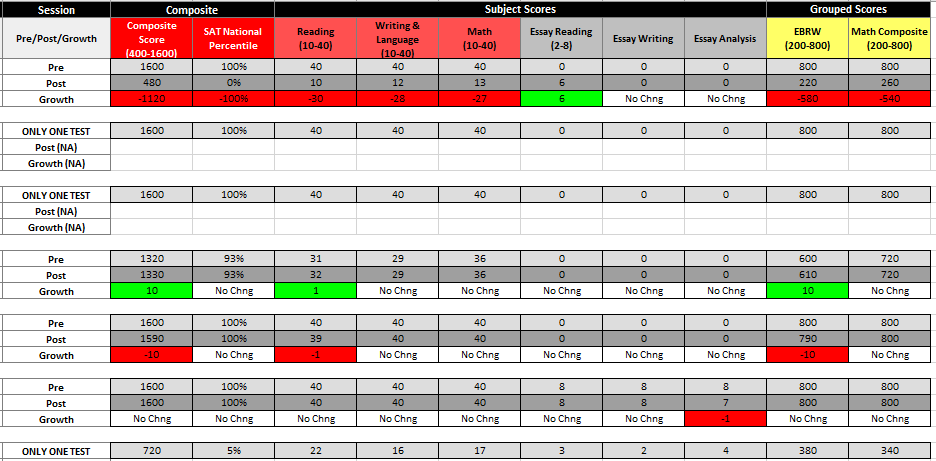
The Performance or Growth over Session Report allows you to compare the performance of a class or group between any two tests or sessions or two batches. This report compares individual student pre and post-scores and calculates growth over sessions for the group of students. The report also includes the average performance of the whole class or batch. Additionally, growth reports or data can be used by students or teachers to see their all-subject performance session by session or test by test. Also, the data or report can be downloaded in formatted excel.
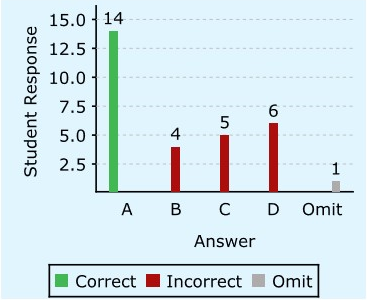
The Question Response Distribution Report allows you to generate detailed insight into each question response. Socrato will analyze each student's response to a multiple-choice question and provide the number of responses. It is possible to interpret what concept the student might be missing by referring to the answer choice.
Question /Answer Distribution Report:
- The answer distribution/item analysis allows an instructor to see which groups of students responded to each answer choice. These patterns indicated common misconceptions about the solution to the question.
- The teacher can quickly see which students gave which responses, differentiated review is possible for different student sub-groups.
- As with other Socrato reports, educators can quickly find similar questions in the library with one click to create a worksheet or future assessment for the strand and skill.
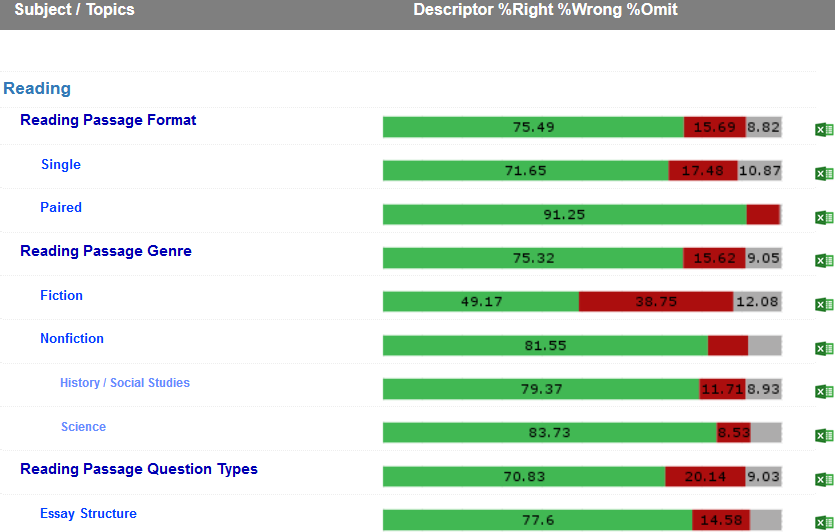
- The Subject Area Analysis Report, you can gain a detailed understanding of a whole class or group of students or an individual student for subject/topic of the exam. This report drills down from level 1 to level n with increasing detials of topics or sub-topics. Furthermore, you can quickly identify students' strengths and areas of imporivement.
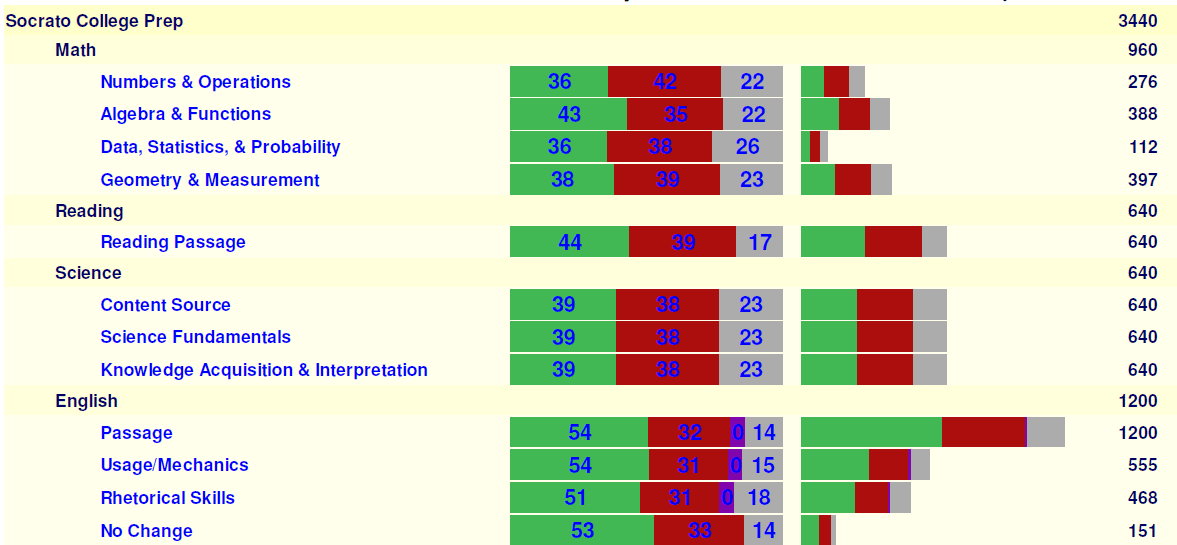
The Class Performance by Subject and Topic Report allows you to get detailed insight about a whole class or group of students for the subject/topics of the given exam.
With this report you can drill down from level 1 to level n with increasing level of detail (Exam > Subjects > Section > Topics > Sub Topics)
The Test Comparison Report allows you to compare the performance of a class or group between two tests. Similar to the Subject Area and Topic Performance Report, it displays the same trends and views. Additionally, it offers the ability to drill down to various levels of detail.
For example:
- Compare Pre and Post-test.
- Comparison between Pre and Midterm tests.
- Similarly, Comparision of Midterm and Post-test.
The Student Comparison Report allows you to compare the performance of individual students in a class/group. Similar to the Subject Area and Topic Performance Report, it displays the same trends and views.
Again, users can drill down to various levels of detail.
The SAT vs. ACT Score Report is available as data to download. Users who have purchased SAT vs. ACT Comparison Test can access this report. Users can download the data and perform the different analyses on the class as a whole or a subset.
The Report contains the following information:
- Student name and ID.
- Student scaled scores by subject and total for both SAT and ACT.
- Percentile and Equivalent scores in SAT and ACT.
- Test Bias analysis.

